In September 2019, Chorlton CLT was one of sixteen community land trusts to be awarded a share of £329,000 to strengthen their membership base and be champions of inclusivity, equality and diversity.
In February of this year we baselined how well Chorlton CLT reflected our local community of Chorlton and Chorlton Park wards, and posted the results from that survey in July.
Following our first AGM in October we asked all our members to complete the same simple anonymous survey, to give us data which could be directly compared with the 2011 census data for our local area. Thanks to everyone who responded.
The total membership has grown from 247 to 314 between February and November, a 27% increase. This is particularly impressive considering that we have been unable to meet face to face for most of this period. The number of board members has also increased from 9 to 12, and we now have a full complement of board members.
As in February just under 80% of our membership live in the local area. Most of the remaining 20% live in neighbouring council wards.
The overall response rate increased slightly from 46% to just under 51%.
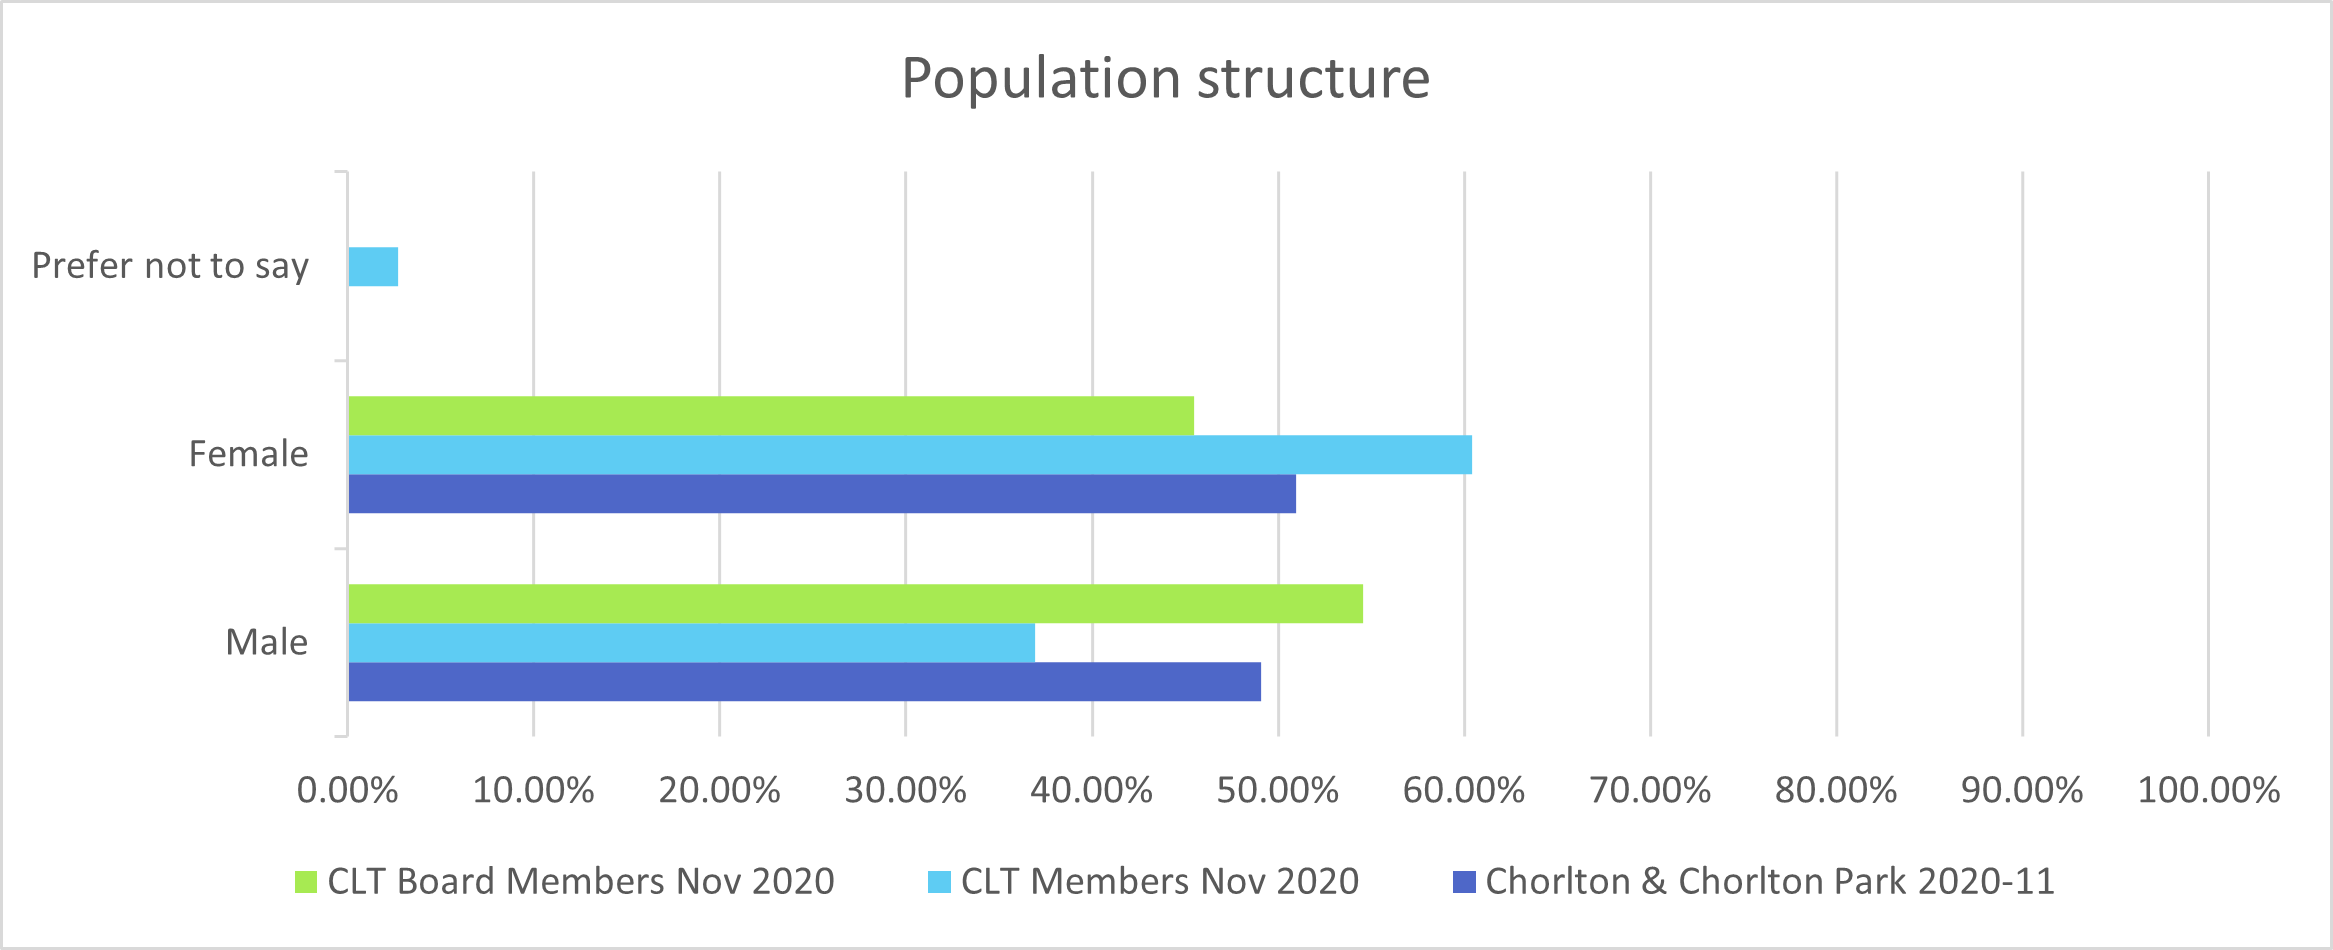
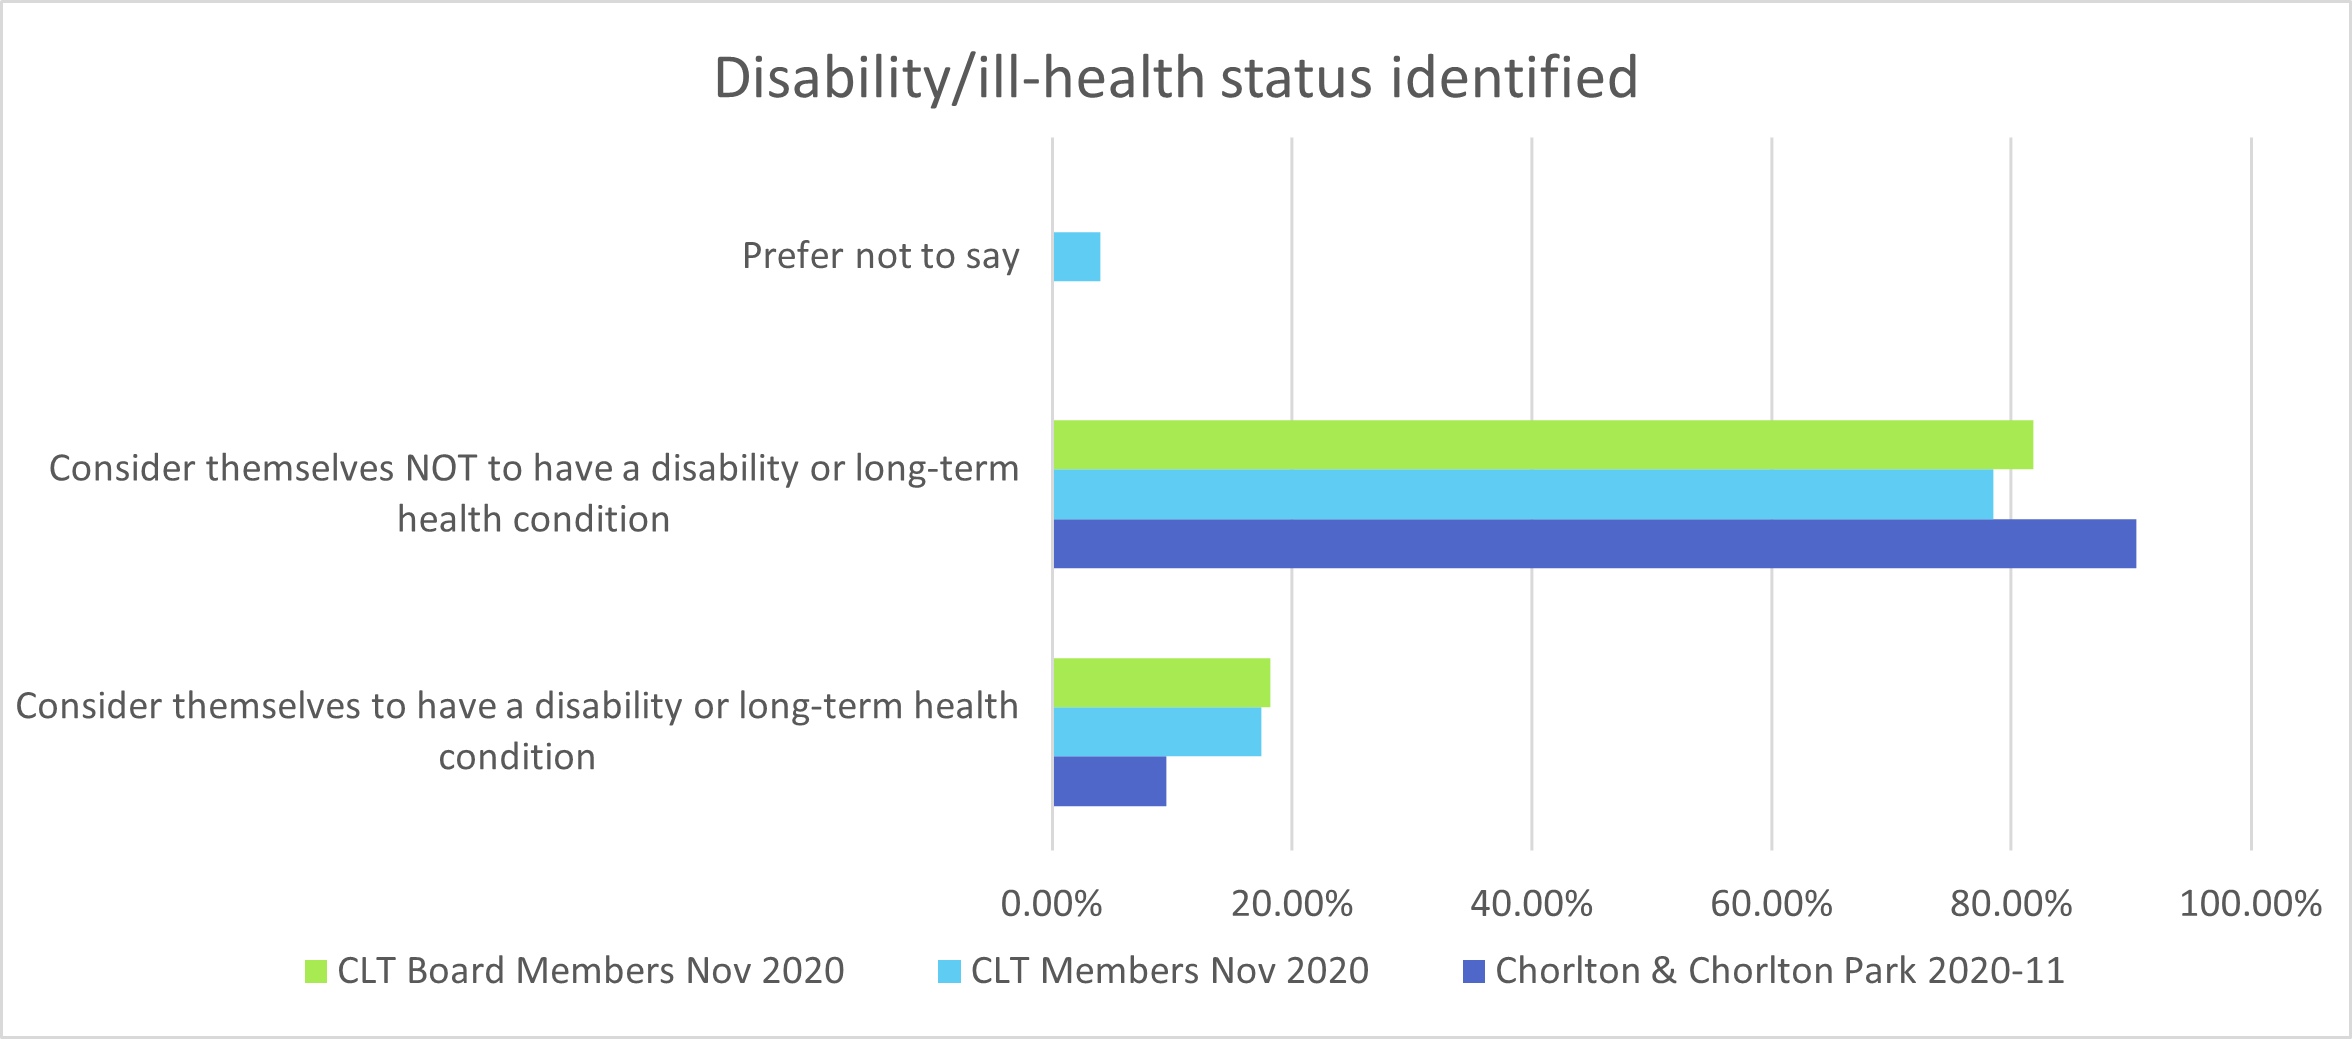
The charts below show the results of the November 2020 survey, and give one view of who we are, but as stated previously, do not give a full picture of the diversity of our membership.